The 18-Year Real Estate Cycle – Booms, Busts, and Predictable Patterns (Part 6 in Series)
Real estate feels like it should be random—prices rise when the economy is good and fall when it’s bad, right? But history tells a different story. Property markets actually follow a pretty reliable 18-year rhythm of boom and bust.
This is Part 6 in my 7-part series on market cycles. If you’re late to the party, check out Part 1 here to catch up.
🏘️ Why 18 Years?
The 18-year cycle is largely tied to land values and credit expansion. Land isn’t something you can make more of, and when credit gets cheap, people rush to buy property. Prices rise, developers build like there’s no tomorrow, and eventually, we hit oversupply.
Economists like Fred Harrison and Homer Hoyt noticed this cycle repeating for centuries. In fact, if you look back at big events like the 2008 housing crash, the timing is almost eerily spot-on—18 years after the early 1990s downturn.
🔄 The Phases of the Cycle
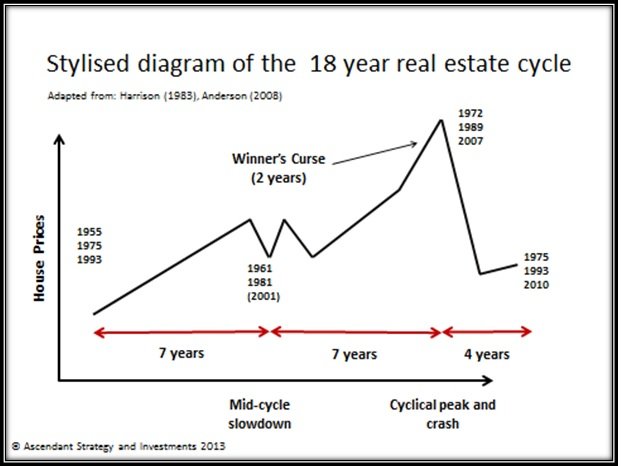
- Recovery (Years 1–7): After a crash, prices stabilize. Investors scoop up bargains.
- Expansion (Years 8–14): Credit grows, construction booms, and prices climb fast.
- Peak (Years 15–18): Speculation takes over. Everyone’s flipping houses, banks loosen lending, and the bubble inflates.
- Crash & Reset: Prices fall hard, over-leveraged buyers get crushed, and the cycle resets.
🏦 Why It Matters
If you’re an investor or even a homebuyer, knowing where we are in the cycle is pure gold. Late in the cycle? Maybe wait on that dream property or take profits. Early in the recovery? It could be the deal of a lifetime.
This cycle also explains why real estate often moves differently than stocks. It’s driven by credit availability, land speculation, and government policies, which all tend to follow predictable rhythms.
📊 Chart for Reference
Here’s a simple chart illustrating the 18-year cycle:
Source: Wikimedia Commons
🖼️ AI Image Prompt (for Header or Social Share)
“A timeline illustration of the 18-year real estate cycle with phases labeled: Recovery, Expansion, Peak, Crash. Include houses, skyscrapers, cranes, and dollar signs rising and falling like a rollercoaster. Warm, inviting colors (greens, golds, browns) with a clean infographic style, 16:9 blog header.”
💬 Final Thoughts
Real estate might look complicated, but when you zoom out, the same patterns repeat over and over. It’s not about timing the market perfectly—it’s about recognizing when greed is high, credit is loose, and the cycle is late. That’s your signal to play it smart.
📚 Next Up: Part 7 will dive into the Hurst Cycle, a fascinating method of analyzing market rhythms through wave patterns and time counts.
✍️ Stay Connected with Grandpa Pulse
![]()
Crypto hustler • Market cycles explorer • Faith & finance from a front-porch philosopher
📲 Follow me on social:
🐦 X (Twitter)
💬 Blurt.blog
📺 YouTube
Meta Description:
The 18-year real estate cycle explains property booms and busts by tracking land values, lending, and market psychology.
Posted Using INLEO